| Copyright July 1, 2000 | Vern Lindberg |
1. Introduction to Graphing, Graph Paper, Computer Graphics
2. Basic Layout of a Graph
3. Curve Fitting
4. Straight Lines on Linear Graph Paper
5. Uncertainties and Graphs: Error Bars
6. Slopes on logarithmic graph paper.(a) Slopes and intercepts on log-log graph paper.
(b) Slope and intercept for semi-log graph.
Part I Uncertainties and Error Propagation |
Part III The Vernier Caliper |
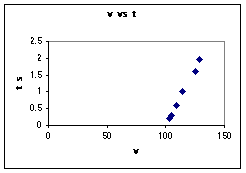
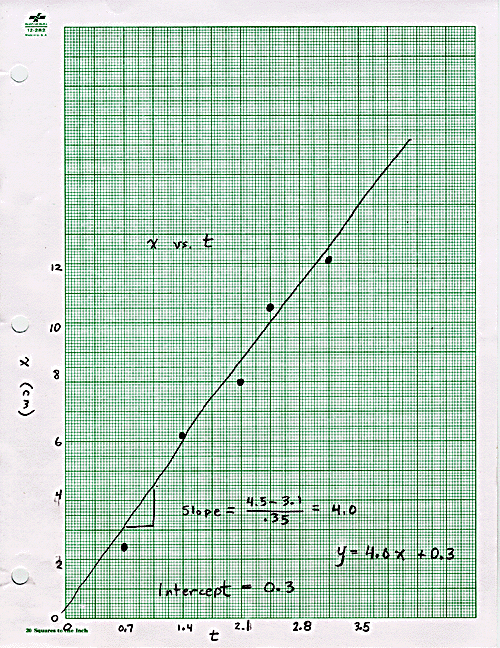
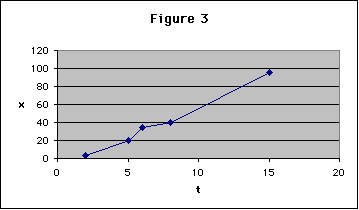
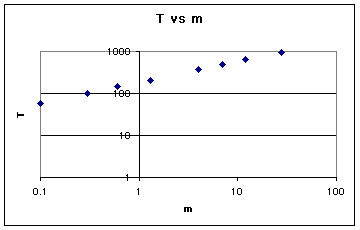
It is instructive to look at graphs that have mistakes. Look at each of the following graphs and determine the mistakes in them. There are usually several mistakes on each graph. Click on the answer button to see what I thought were the mistakes, and a corrected graph.
(a) Here is a linear graph on the computer. Find 7 mistakes. Here is what I found.
(b) Here is a hand-drawn linear graph. Can you find10 mistakes? Here is what I found.
(c) Here is another computer drawn linear graph with problems.Can you find 7 mistakes? Here is my answer.
(d) Here is a poor log-log graph on a computer. Can you find 7 mistakes? Here is my answer.
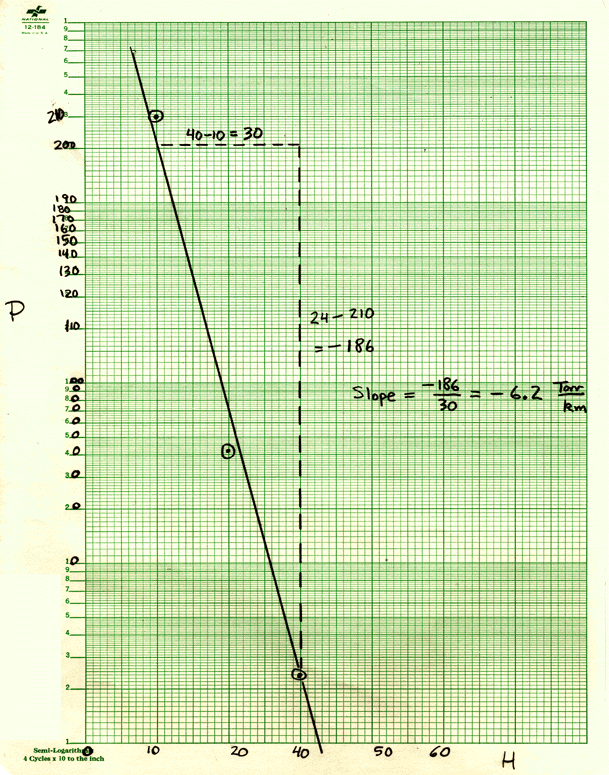
(e) Here is a poor semi-log graph. Can you find 8 mistakes? Here is my answer.
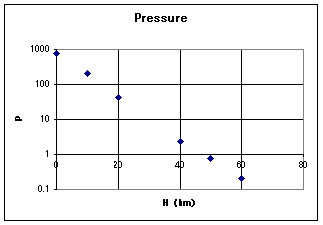
(f) Here is a bad semi-log on a computer. Can you find 6 mistakes? Here is my answer.
| Abscissa | The horizontal axis. Usually the independent variable is plotted on the abscissa. See ordinate. |
| Axis Label | Each axis is labeled with the name of the variable, possibly the symbol of the variable, and the units. |
| Dependent Variable | The variable which we do not control, but only measure. Normally it is plotted on the vertical or ordinate. See independent variable. |
| Directly Proportional | A linear relationship with an intercept of zero. A graph of a linear relationship passes through the origin. |
| Error Bars | Vertical and/or horizontal marks indicating the possible range of values in a graph point. Usually one standard deviation long. |
| Graph Paper | Finely divided grid on which graphs can be drawn. Typically 10 squares to the inch, 20 squares to the inch, or 10 squares to the centimeter. Other types of graph paper exist. See quadrille paper. |
| Independent Variable | The variable over which we have control. Normally it is plotted on the horizontal or abscissa. |
| Intercept | For linear or semi-log graphs, the value of the ordinate (vertical) coordinate of a graph when the abscissa (horizontal) is zero. For log-log graphs, the value of the ordinate when the abscissa equals 1. It is also called the Y-intercept. It has the units of the ordinate. See slope, X-intercept, Y-intercept. |
| Log-Log Paper | Both axes are logarithmic scales. The divisions are marked on the paper and cannot be changed except to move the decimal point (tick mark 2 can be 0.02, 0.2, 2, 20, etc.) Special techniques are used to find slope and intercept. |
| Ordinate | The vertical axis. Usually the dependent variable is plotted on the ordinate. See abscissa. |
| Quadrille Paper | Usually a coarse grid (4 squares to the inch) useful for making engineering drawings, but not suitable for graphs. See graph paper. |
| Rise | The difference in the vertical coordinates of two points used to find the slope. The points should be far apart. See run. |
| Run | The difference in the horizontal coordinates of two points used to find the slope. The points should be far apart. See rise. |
| Scale | The choice of how many graph paper squares will represent 1 unit of the data. To allow easy reading of the graph choose 1 unit = 2, 5, or 10 squares. |
| Semi-Log Paper | Graph paper with one axis (usually the horizontal) that is linear and one (usually vertical) that is logarithmic. The divisions on the log scale are marked and cannot be changed except to move the decimal point. Special techniques are used to find slope and intercept. |
| Slope | The quantity M in the straight line equation Y = MX+B, it equals Rise/Run and usually has units. See intercept. Special techniques are used to find slope and intercept on graphs with log scales. |
| Tick Marks | Marks that extend into the margins of the graph paper to show exactly where the division label (number) is to be applied. See examples on graphs in this manual. |
| Title | The title of a graph should include a Figure number, and useful information about what is being plotted. It should not just repeat the axis labels. |
| X-Intercept | For linear or semi-log graphs, the value of the abscissa (horizontal) coordinate of a graph when the ordinate (vertical) is zero. For log-log graphs, the value of the abscissa when the ordinate equals 1. It has the units of the abscissa. See slope, Intercept, Y-intercept. |
| Y-Intercept | Another name for the intercept. See the definition there. See slope, Intercept, Y-intercept. |