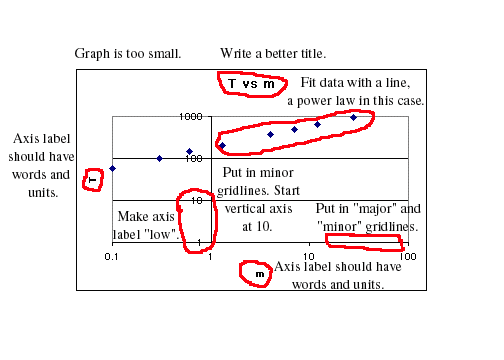

1. The graph is too small.
2. A better title is needed.
3. Axis labels should include the name of the quantity and its units.
4. Minor gridlines should be shown as well as major gridlines.
5. Axis labels should be at the left or bottom of the graph. To do this, double click on the axis, use the "Patterns" and make "Tick Mark Labels Low".
6. The vertical axis can start at 10, not 1. To do this double click on the axis, and on "Scale" make "Minimum 10".
7. Fit the data with a line and display its equation. This is done by "Chart", "Add Trendline", "Power" and the "Options", "Display equation".
The following is a better graph.
