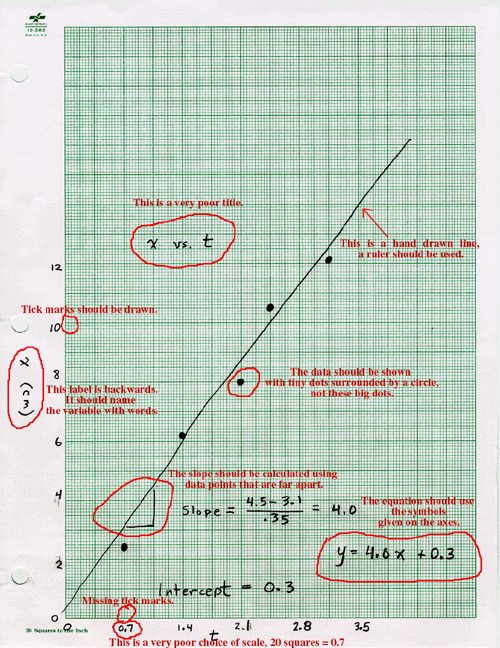

1. The title is very poor. It should be in words and explain what is being plotted.
2. The axis labels should have the quantity in words, for example, "Position, x (cm)."
3. The label on the vertical axis is reversed from the orientation it should have.
4. The axis should have tick marks indicating the major and minor divisions.
5. The horizontal scale is poorly chosen, with 20 squares = 0.7 sec. This makes it very hard to plot a point at 1.32 s, for example.
6. Data points should be small dots surrounded by a circle.
7. A ruler should be used to fit a line to the data.
8. Use widely separated points in order to calculate a slope.
9. Slope and intercept should have units.
10. The equation should use the symbols used for the axes, and should have units included. So write "x = (4.0 cm/s) t + (0.3 cm)."
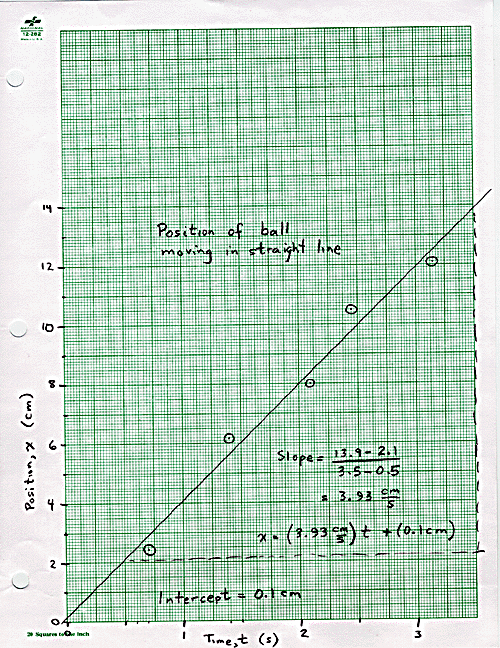
A corrected version of this graph is below.
