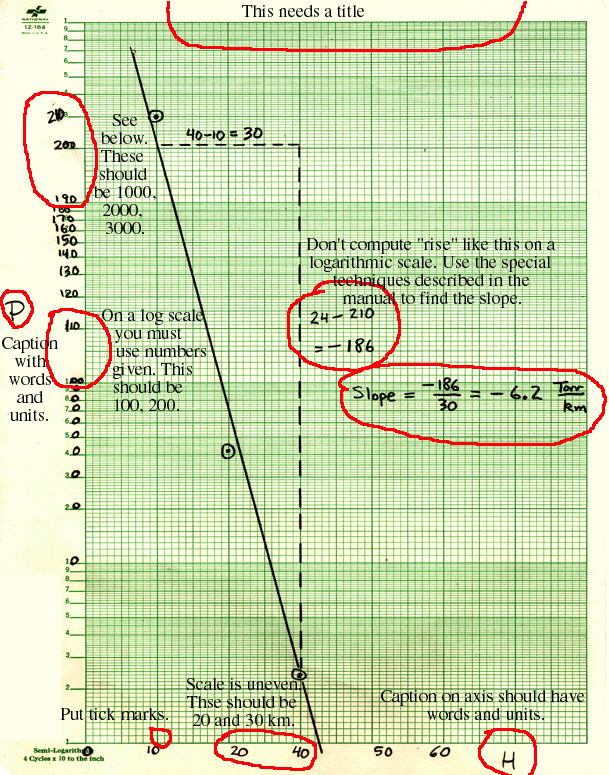

1. Every graph needs a title.
2. Axes should be labeled with words and units, for example "Pressure, P (Torr)."
3. The vertical axis should be rotated counterclockwise by 90 degrees.
4. You should have tick marks on the horizontal axis.
5. The horizontal axis has a mistake, it is missing "30": 10, 20, 40, 50, 60!
6. A logarithmic scale is set up already with numbers next to the tick marks. You cannot change these numbers, you can only move the decimal point on them. I really screwed this up here!
7. You do not compute rise on a log scale. Instead use the methods described in the manual to find slope.
8. The equation of the line should appear on the graph.
Below is my fix to this graph.
