
DESCRIPTIONS OF VIBROCORES FROM THE CAUVERY DELTA
by
Professor George F. Hart, Ph. D.
Field activities in the Cauvery Delta
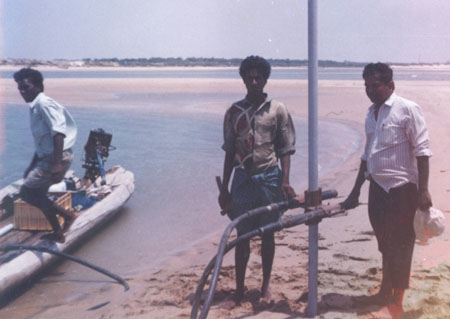
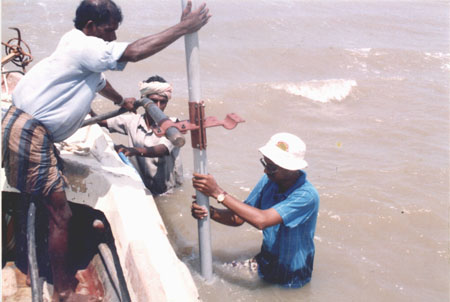
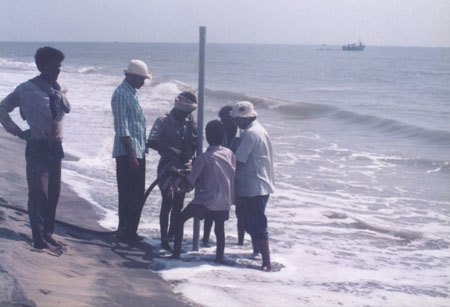
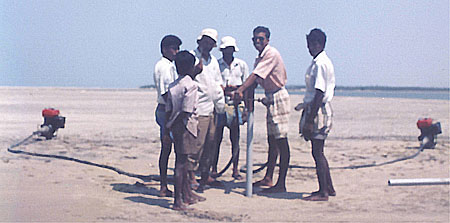
The field work for the collection of the Cauvery Delta vibrocores was organized by personnel from the Sedimentological Laboratory at Andhra University under the guidance of Professor A. S. R. Swamy and Associate Professor Bhanu Murty. The management of the field crew was under the direction of Professor Murty and Dr. J. Seetharamaiah.
The cores were taken with standard vibrocore equipment and returned to Visakhapatnam where they were cut into two halves in the laboratories of the Indian Geological Survey, Visakhapatnam. Photographs were taken of the archival split and are reproduced here, together with the [modified] core descriptions undertaken by the Dr. M. K. Gandhi [mkg] of the Sedimentological Laboratory at Andhra University.
X-ray mineralogical analysis, grain size analysis and heavy mineral analysis was performed
on selected spot samples from the cores. The
sampling locations are indicated in the descriptions:
x locations are X-ray mineralogical sample locations
g locations are grain size characteristics locations
c locations are heavy mineral analysis locations.
The Cauvery Delta sedimentation was studied by Seralthan [Ph.D. dissertation, 1979] amongst others. In the present study a surface sample plus a core was taken at each of seventeen [17] field stations. The cores were taken using a vibrocoring tool, with a maximum core recovery of 113 inches. The depositional environment of each core and it’s length are given in Table 2; the core description in Table 5.
Table 2
|
VIBROCORE # |
Depositional Environment |
Length [inches] |
|
1 |
Sand spit |
40 |
|
2 |
Shore face |
51 |
|
3 |
Estuary |
25 |
|
4 |
Island [lagoonal] |
98 |
|
5 |
Lagoon |
54 |
|
6 |
Levee [mudflat] |
113 |
|
7 |
Estuary [channel] |
33 |
|
8 |
Barrier Island |
35 |
|
9 |
Barrier Island |
43 |
|
10 |
Barrier Island |
38 |
|
11 |
Shoal [channel] |
79 |
|
12 |
Tidal Creek |
97 |
|
13 |
Mangrove Swamp |
62 |
|
14 |
Barrier Island |
64 |
|
15 |
DMB [channel] |
38 |
|
16 |
Mangrove Swamp |
76 |
|
17 |
Tidal creek |
42 |
The sample location map, lithologs showing the location within the core of all samples taken for laboratory analysis; and, the photologs of the cores, are available on the Cauvery Delta CD.
The vibrocores were taken from the field to the laboratory at Andhra University, Visakhapatnam. The cores were sawn in the workshop of the Visakhapatnam Branch of the Indian Geological Survey and then cut into two equal halves longitudinally in the Sedimentological Laboratory at Andhra University. Each half of the core was then cleaned and examined to determine the sedimentary features. One half of the core was designated the archival split and was photographed to develop the photolog. The individual photographs of these samples can be accessed from the CD. In addition, a video record was made of the archival split. The second half of the core was designated the sampling split and was used to determine the general sequence of lithologic facies and the location of sampling points for detailed analytical study. This produced the litholog. Three separate sets of spot-samples were taken and designated the coarse fraction set [c], the grain sample set [g] and fine fraction set [x]. The locations of these samples are given on the lithologs and the photologs.
The fine fraction samples [x-set] were taken to Louisiana State University, Baton Rouge and processed in the x-ray mineralogy laboratory for both bulk minerals and clay minerals. The data derived from these analyses [as weight percentage] are provided in as bulk mineral, clay mineral and organic matter tables. These data were then subjected to a variety of statistical procedures to derive an understanding of the abundance of the various mineral types in the depositional environments; and, an assessment of their ability to discriminate one environment from another. The general overview of the abundance of the various mineral types is summarized in the statistical diagrams. The assessment of the ability of the various mineral types to discriminate one environment from another was made using discriminant function analysis using the methods described previously [Hart et al , 1989; Hart 1994; Darby & Hart 1994; and, Ferrell, Hart et al 1998.
The Statistical Analysis System [SAS] procedures were used to develop the assessment of the ability of the various minerals to separate one environment from the other using a SAS program that generates the basic analyses. A second program was written that generates probability tables for classifying samples from unknown environments, derived from the vibrocores, into a particular depositional environment.
The output from the SAS DISCRIM program show that the various depositional environments can be readily separated using the bulk mineral analyses. This provides a strong tool for assessing the three dimensional architecture of the Cauvery delta: particularly during the period of human occupation.