| <-- Previous Page | Course Outline | Page 6 of 6 |
| Sections | Day 1 | Day 2 | Day 3 |
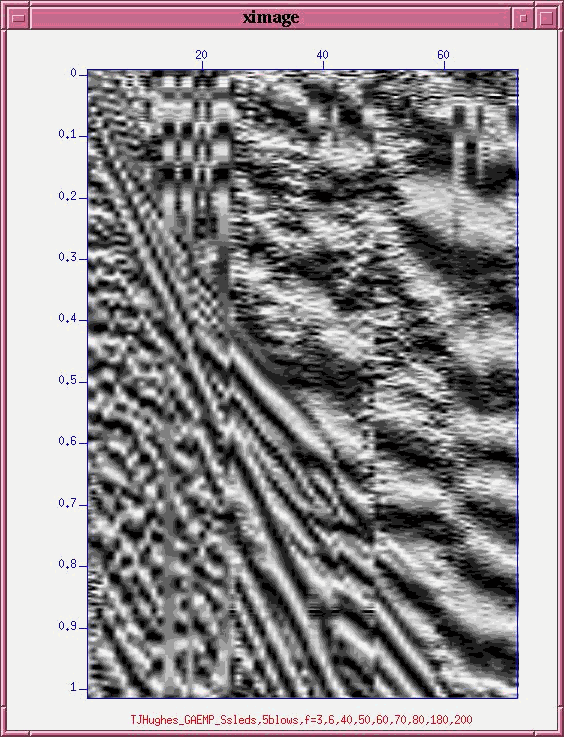
Slide presentation displaying horizontal-component seismic data collected north and south of an active fault line scarp by students the previous day.
Analysis techniques for reflection data:
- X2 –T2 method.
- Derivative method
Analysis techniques for refraction data:
- One-layer refraction method
Seismogram of horizontal component data (E-W) Horizontal scale is trace number. Trace spacing is 3m. Vertical scale is in seconds.
