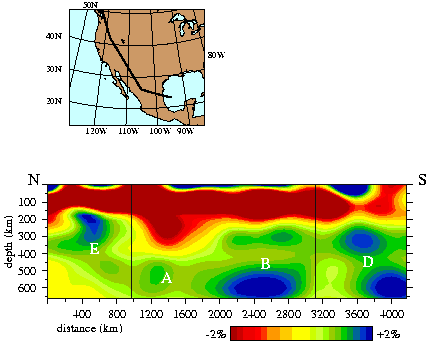

This figure shows a cross section view of the velocity structure of the upper mantle, below Western North America, down to the 660 km discontinuity. The red zone indicates low velocities under the Cordillera mountain range. The blue zone represents higher velocities, which correlate to dense material at depth, which could indicate remnants of the subducted Farallon plate.