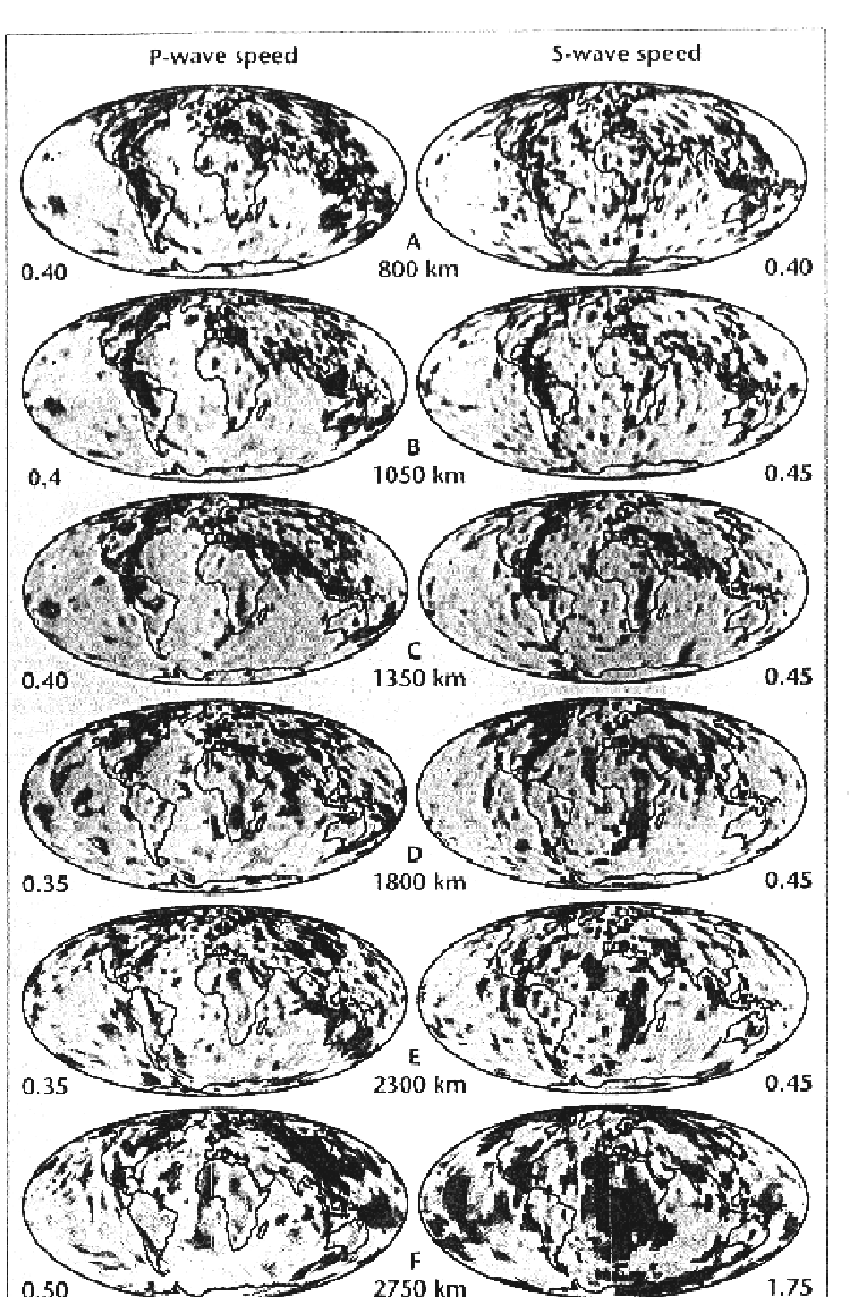

Image showing comparison of variations in velocity, in both P and S wave models, with depth through the lower mantle. Numbers at the side represent maximum percent difference from mean velocity. Dark areas indicate high velocity and some correlate to areas of ancient subduction. Taken from Grand, van der Hilst, and Widyantoro, GSA Today, V7,N4,April 1997.